How to Choose a Bottle Filler in 2026?
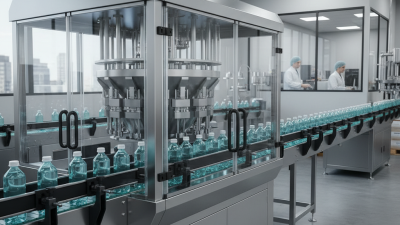
Choosing a bottle filler in 2026 requires more than comparing speeds, prices, and polished product brochures. Production conditions matter. A machine filling still water may fail with thick sauces, foaming beverages, or fragile glass containers. Your product, bottle shape, closure, factory layout, and cleaning routine must guide the decision.
Krones specialist Dr. Volker Kronseder once emphasized, “Efficiency is not only speed; it is the intelligent use of resources.” This principle remains practical when reviewing modern filling equipment. A reliable bottle filler should control fill levels accurately, reduce product loss, and support stable changeovers. Watch the machine during testing. Look for dripping valves, uneven fills, difficult access points, and wasted rinse water. Small faults become expensive during long production runs.
Think beyond the first quotation. Ask about maintenance access, spare-part availability, operator training, data tracking, and integration with conveyors or capping systems. A servo-driven filler may offer excellent control, but it can add complexity for a small plant. An automated cleaning system may save labor, yet it still needs correct validation and careful monitoring. More technology is not always better. Sometimes, it is simply more technology.
Your final choice should come from measured trials, not attractive assumptions. Request samples using your real bottle, liquid, temperature, and production speed. Record fill accuracy over several hours. Check the results twice. Even experienced teams can overlook seasonal viscosity changes or awkward bottle handling. The best bottle filler is the one that performs consistently, cleans responsibly, and fits your people, products, and future capacity.
Define Your Bottle Filling Needs and Production Requirements
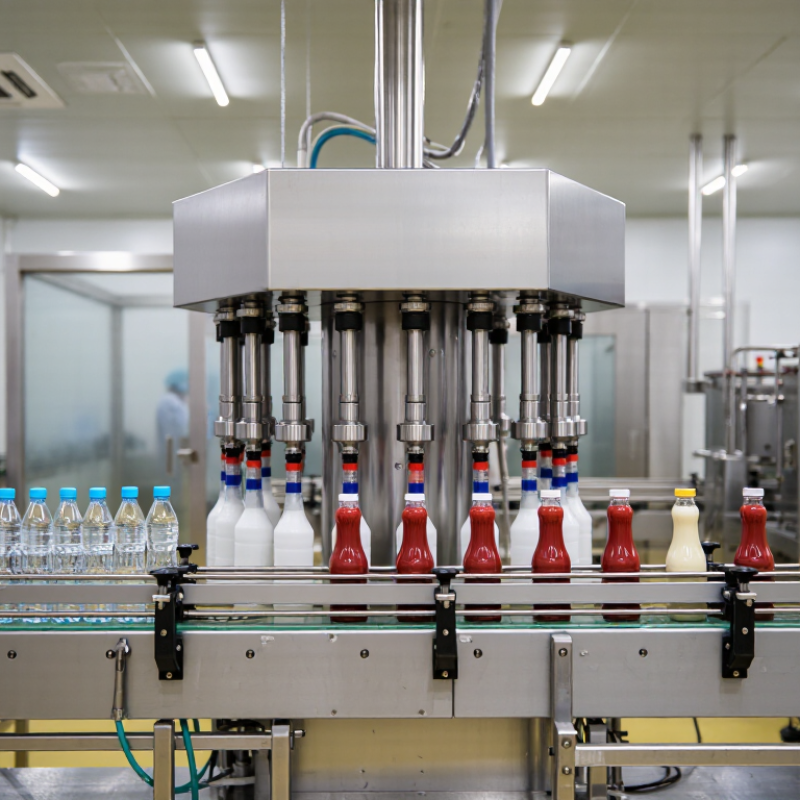
Before comparing bottle fillers, define the product and shift target. Record liquid viscosity, foaming tendency, temperature, and particulates. Note whether containers are PET, glass, or another material. Measure neck finish, fill volume, and bottle stability; a narrow neck or lightweight bottle can affect nozzle choice and handling. Small details matter.
Set realistic output using sellable bottles per hour, not brochure speed. Allow for changeovers, sanitation, breaks, rejects, and limits on connected equipment. If the filler can manage 3,000 bottles per hour but the capper handles only 2,400, extra filler speed adds no usable capacity. Test with your actual liquid and containers. Water alone may hide foaming or dripping.
Market growth gives context, not a factory forecast. Grand View Research estimated the global bottled water market at USD 303.9 billion in 2023 and projected a 6.7% compound annual growth rate from 2024 to 2030 in its Bottled Water Market Size, Share & Trends Analysis report. That outlook cannot determine your shift volume. Base requirements on orders, seasonality, storage, and planned product variations. Specify fill accuracy, cleaning method, footprint, and utility limits. One question deserves a second look: are demand estimates grounded in orders, or in peak-week optimism? Some capacity may sit idle.
How to Choose a Bottle Filler in 2026: Define Your Production Requirements
These illustrative targets are calculated from bottles per minute multiplied by 60. Use your peak hourly demand to set a throughput goal, then account for product viscosity, bottle size and shape, number of filling nozzles, and changeover or downtime. Actual output varies by equipment and operating conditions.
Compare Bottle Filler Types and Their Operating Principles
Bottle fillers differ by water source and delivery mechanism. Direct-plumbed units connect to a drinking-water line. A sensor or push button opens a valve, and water flows through the nozzle. Filtered models route it through a replaceable cartridge; refrigerated versions chill water in a tank or coil. Ambient models skip cooling. Fewer components, but no cold water.
Jug-fed units use an inverted reservoir, gravity, or an electric pump. They can work without plumbing, though staff must replace heavy jugs.
The International Bottled Water Association’s 2023 market report estimates U.S. bottled-water consumption at about 16.4 billion gallons.
That signals a substantial refill opportunity, not local demand by itself. Check peak-hour use, water pressure, drainage, bottle clearance, and filter capacity. A narrow hallway may favor a compact wall-mounted unit; a busy cafeteria needs faster recovery between fills.
Cold-water performance also depends on how often people refill. That detail is easy to miss.
Assess Filling Accuracy, Speed, Hygiene, and Automation Features
How to Choose a Bottle Filler in 2026?
Filling accuracy should come before advertised speed.
Test the machine with your actual liquid, bottle, and closure. Record the average fill weight, repeatability, and reject rate across several production runs. A filler that reaches 120 bottles per minute may still waste material through overfilling. I would request gravimetric test results, not only a brochure claim. ISO 5725 principles can help separate repeatability from true measurement accuracy.
Speed must include real production conditions.
Ask for output during startup, container changes, cleaning, and minor stoppages. PMMI’s 2024 State of the Industry reporting identifies labor availability and operating efficiency as major packaging concerns. That makes fast changeovers valuable. Ten quiet minutes matter.
However, my own practical warning is simple: maximum speed is rarely sustainable speed.
Hygiene requires visible design details.
Look for drainable product paths, polished contact surfaces, minimal dead legs, and tool-free access. Cleaning validation should include swab points and documented inspection steps. Automation should support people, not hide problems. Deloitte’s 2024 Smart Manufacturing and Operations Survey found that 86% of manufacturers expect smart manufacturing to become a major competitiveness driver within five years. Useful features include recipe control, fill-level feedback, automatic rejection, electronic batch records, and alarms for drift. Yet excessive automation can complicate troubleshooting. Leave operators clear access and understandable screens. That part is often overlooked.
Review Installation, Maintenance, Safety, and Total Ownership Costs
When choosing a bottle filler, inspect the installation site before comparing unit prices. Measure wall backing, drain access, bottle clearance, and the route to a shutoff valve. A crowded corridor can make routine repairs awkward. Check electrical needs, too; not every unit requires the same connection. The cost model is imperfect, but include installation, filters, replacement parts, water use, and expected service life. A low purchase price can hide expensive maintenance.
Safety depends on both the filler and the plumbing feeding it. The U.S. EPA’s 2023 Drinking Water Infrastructure Needs Assessment estimates $625 billion in drinking-water investment over 20 years and identifies about 9.2 million lead service lines. These are national infrastructure estimates, not a prediction of risk at one building. Still, they make it wise to review utility water-quality reports and test at the outlet when conditions warrant. Check that wetted materials meet applicable NSF/ANSI 61 requirements, and confirm filter claims against the exact model.
Keep it practical. Ask how filters are changed, whether replacement indicators are clear, and how quickly parts can be obtained. Record filter changes and service calls; small omissions become costly. A simple log helps. Compare annual costs using realistic use and local labor rates, not optimistic assumptions. Maintenance intervals vary with water quality and traffic, so treat the manufacturer’s schedule as a starting point, then adjust from site records.